
The Future of Research Is Visual, Not Linear

A researcher's desk viewed from above, showing scattered notes, diagrams, and open books arranged in a non-linear spatial pattern, suggesting visual and exploratory thinking rather than sequential reading

The research process is no longer a straight line from question to answer.

The Linear Research Model Is Breaking Under Its Own Weight

Most research workflows follow the same basic pattern: open a tab, read an article, take notes, open another tab, repeat. At the end, you synthesize everything into a document. It feels structured. It's actually a slow-motion bottleneck.

The problem isn't discipline or effort. It's architecture. Sequential, text-heavy research was designed for a world where information was scarce. Today, the opposite is true. Creators and researchers face an overwhelming volume of sources, threads, and tangents — and a linear workflow is poorly suited to handle the load.

What breaks first

When you work linearly, connections between ideas are invisible until you've already finished reading. By the time you're writing, you've forgotten the exact detail from source four that directly contradicts source twelve. You lose the relationship between concepts because your notes are stacked in a list, not mapped as a network.

This creates three compounding problems:

  • Cognitive overload: Holding multiple threads in working memory while reading new material is exhausting and error-prone.
  • Missed connections: Key relationships between sources and ideas go unnoticed when everything is buried in sequential notes.
  • Slow synthesis: Assembling a coherent argument from linear notes means re-reading and re-processing material you've already consumed.

The volume problem isn't going away

Modern content creators aren't researching one topic per week. They're managing multiple projects, multiple formats, and multiple deadlines simultaneously. A workflow that struggles at low volume fails entirely at scale.

Linear research also reinforces a false boundary between the research phase and the writing phase. In practice, good writing surfaces gaps that send you back to research. That back-and-forth is natural — but it's brutal inside a linear system that treats the two as separate stages.

The takeaway: If your current research process feels harder as your output grows, the workflow itself is the bottleneck — not your capacity.

How the Brain Actually Processes Information (Hint: Not in Straight Lines)

There's a widely cited figure in cognitive science that stops most researchers cold: the brain processes visual information 60,000 times faster than text. Read that again. Not 60 times. Not 600 times. Sixty thousand.

Yet the dominant research workflow still looks like this: open a document, read from top to bottom, take notes in a linear list, repeat. It's a system designed around how printing presses work — not how brains do.

The problem with linear formats

Linear text is efficient for recording conclusions. It's poor at revealing relationships. When you arrange ideas sequentially, you force a single path through complex material. You can follow the argument, but you can't see the terrain.

Spatial and visual representations work differently. When information is arranged in two dimensions — as a map, a cluster, a network — the brain can scan across it, notice proximity, spot outliers, and detect patterns that a bulleted list would bury. Pattern recognition doesn't happen by reading; it happens by seeing.

What externalized thinking actually does

Cognitive scientists use the term cognitive offloading: moving mental work onto external representations so your working memory can operate at a higher level. A whiteboard isn't just useful because it's bigger than your head. It's useful because it frees you to think about relationships rather than trying to hold individual facts in place.

The same principle applies to research. When you can see your sources, themes, and gaps spatially arranged in front of you, you stop managing information and start analyzing it.

Practical takeaway: The next time you're stuck on a research problem, don't add more notes to a document. Try externalizing what you know visually — group sources by theme, draw connections between ideas, map the gaps. Often the insight you've been searching for was hidden by the format you were using to find it.

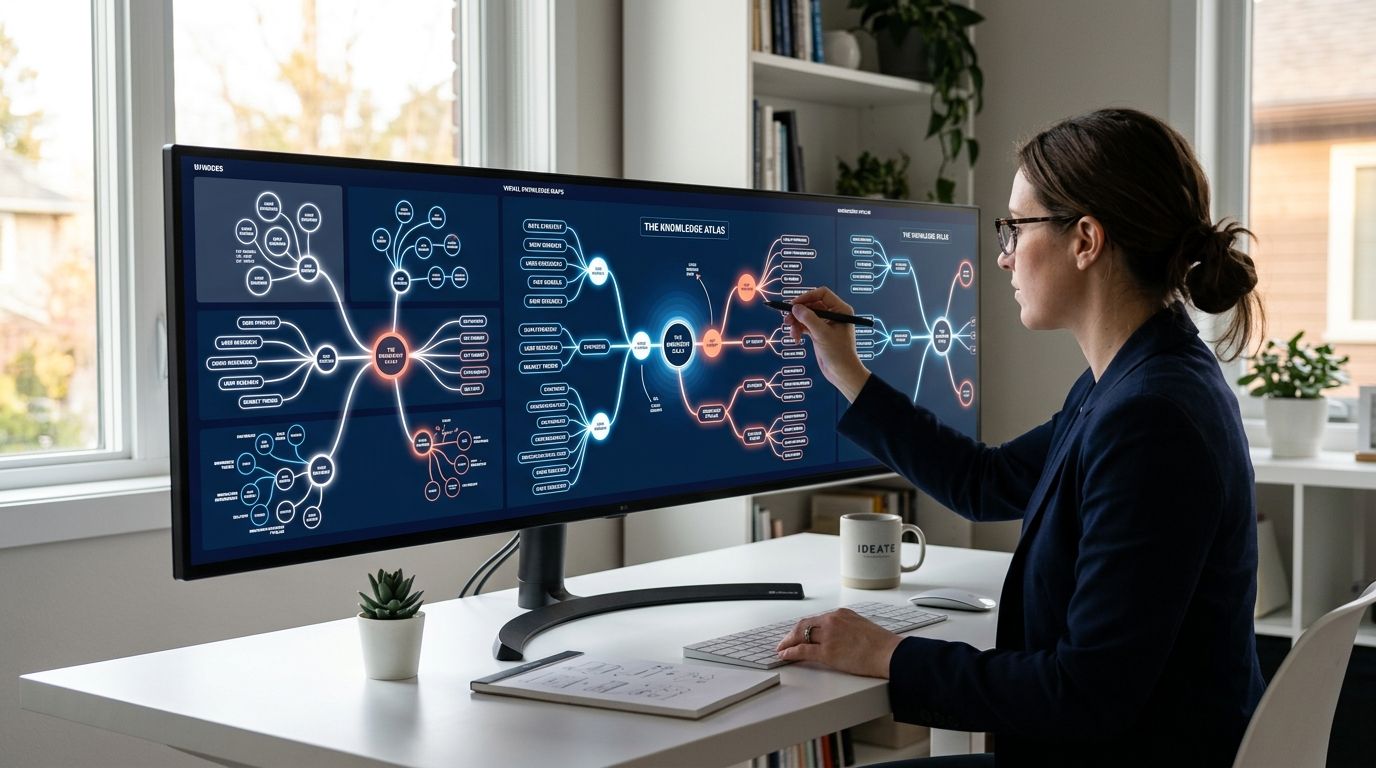
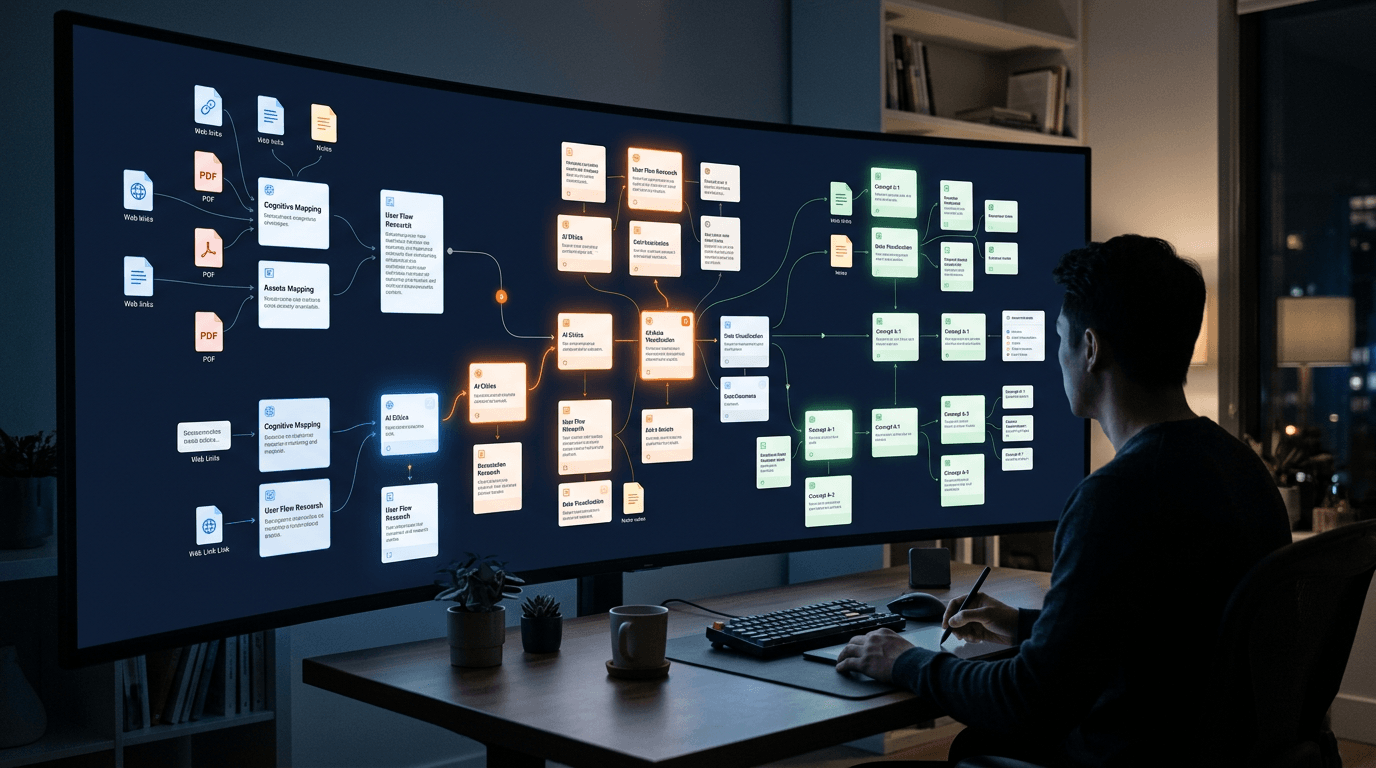
A digital research canvas showing interconnected nodes and branches representing non-linear research exploration across multiple topics and sources

Non-linear research maps relationships between ideas — not just sequences of facts.

Traditional research has a shape: you start at step one, move to step two, and arrive at a conclusion. It's tidy, but that structure often forces you to stop exploring before you've found the unexpected connection that changes everything.

Non-linear, visual research looks different. Imagine starting with a central question, then branching outward — one node for source material, another for competing claims, another for related subtopics. Each branch can be explored independently, recursively, or in parallel. You're not following a path; you're mapping a territory.

In practice, this might mean opening a research canvas where sources cluster around themes rather than sit in a chronological reading list. You spot a pattern between two sources that your linear notes would have kept 40 steps apart. That spatial proximity changes what you notice.

The iterative loop matters here. Instead of research-then-write, the workflow becomes: explore → surface a connection → draft around it → discover a gap → research that gap → revise. It's recursive, not sequential. Each pass deepens understanding rather than simply adding volume.

For content creators, this shift has a practical payoff. Richer conceptual maps produce more nuanced writing. Arguments become more layered when you've seen how ideas relate, not just what they say individually. Non-linear research doesn't slow you down — it removes the dead ends that linear workflows hide until you're already 2,000 words in.

Emerging Tools Redefining the Research Landscape

The shift from linear, text-based research to dynamic, visual discovery is being driven by a specific set of emerging technologies. Each one addresses a different friction point in the traditional read-then-write workflow.

LLM-Native Figures

These AI-generated visual representations translate dense text outputs into structured diagrams, concept maps, and relational charts — making complex findings easier to parse at a glance rather than buried in paragraphs.

Recursive AI Research Agents

Unlike a single query-and-response model, recursive agents iterate — generating a finding, identifying gaps, querying further, and updating their understanding automatically. Research becomes a loop, not a line.

GPU-Accelerated Data Interaction

Processing power once reserved for rendering games now drives real-time data exploration. Researchers can manipulate large datasets interactively, spotting patterns that only emerge when you can move through the data rather than read about it.

Spatial Knowledge Graphs

Instead of flat document hierarchies, spatial graphs let researchers position concepts in relation to one another. The layout itself carries meaning — proximity, clustering, and distance all communicate what linear lists cannot.

Multimodal Search Interfaces

Search is no longer just keyword-driven. Emerging tools let users query with images, diagrams, or mixed inputs, returning results that match intent and context rather than matching text strings alone.

Interactive Citation Networks

Static bibliographies are giving way to explorable citation graphs where researchers trace how ideas evolve, where consensus forms, and where gaps in the literature exist — visually, not through manual review.

AI-Assisted Synthesis Layers

Rather than summarizing a single source, synthesis tools pull across dozens of documents to surface contradictions, common threads, and unanswered questions — compressing hours of comparative reading into structured, reviewable outputs.

A writer surrounded by scattered browser tabs and paper notes, illustrating the friction of switching between research and writing tools

Every tab switch is a context tax — and it compounds across a writing session.

Most writers have felt it: you're deep in a research tab, annotating a source, building momentum — then you switch to your writing tool and the thread snaps. You're no longer a researcher. You're a writer trying to remember what the researcher just figured out.

This isn't a workflow quirk. It's a structural problem. When research and writing live in separate tools, every transition carries a tax: reformatting notes, copy-pasting quotes, hunting back through browser tabs to verify a detail you half-remember. Each switch adds minutes. Collectively, those minutes add up to hours of lost focus every week.

The cognitive cost is just as real as the time cost. Context-switching forces the brain to rebuild its working model of a topic from scratch each time you return. Nuance slips. Connections you spotted during research don't make it into the writing. The insight that felt obvious in your notes becomes vague by the time you reach your draft.

Linear workflows make this worse. When research is a phase that ends before writing begins, the two never inform each other. You can't follow a new thread that emerges mid-draft. You can't verify a claim without leaving your document.

Integrating research and writing into a single workspace removes this friction. Not because the tasks merge — they don't — but because the distance between them collapses. Sources stay visible. Notes stay contextual. The insight you find at paragraph three doesn't require a tab-switch to verify. It's already there.

Visual Thinking Is No Longer Just for Designers

For years, "visual thinking" carried a professional qualifier. It was the domain of UX designers, architects, and creative directors — people who worked with whiteboards and wireframes for a living. Researchers, writers, and content professionals were supposed to work with text: read, annotate, outline, draft.

That boundary no longer holds.

The real reason visual thinking is becoming universal

The shift isn't about aesthetics. It's about cognitive limits. When information exists as a linear sequence of text, your brain processes it serially — one idea at a time, in a fixed order. But insight rarely follows a fixed order. Connections between ideas, patterns across sources, contradictions in the data — these are spatial relationships. They reveal themselves when information is arranged in space, not in a line.

The brain processes visual information approximately 60,000 times faster than text. That gap doesn't disappear just because your job title says "researcher" instead of "designer."

What this means for content professionals specifically

Researchers and writers are now handling more sources, more formats, and tighter deadlines than ever. The old approach — read everything, take linear notes, write a structured outline — creates a bottleneck at every stage.

Visual organization breaks that bottleneck:

  • Source clustering lets you see which ideas have strong evidence and which don't
  • Spatial outlining reveals structural gaps before you start writing
  • Non-linear exploration allows you to follow a thread without losing the broader map

The practical takeaway

If you're still working exclusively in linear documents — top-to-bottom notes, sequential outlines, one-file-per-draft — you're working against how insight actually surfaces. Start with a visual layer. Map your sources before you write. Arrange your arguments spatially before you commit to structure.

Visual thinking isn't a creative shortcut. It's become a core competency for anyone whose job is to turn information into something useful.

How Information Structure Shapes What Gets Discovered

In an AI-assisted research environment, the way knowledge is organized determines what surfaces, what gets acted on, and what stays buried. Structure isn't just presentation—it's a filter on insight.

Hidden connections stay hidden in flat text

When research lives in linear documents, relationships between ideas only emerge if someone reads carefully enough to spot them. Spatial and visual organization makes those connections visible by default.

Retrieval patterns determine research outcomes

AI tools surface what's well-structured and clearly labeled. Loosely organized notes or untagged sources get deprioritized—not because they're less valuable, but because structure signals relevance.

The first frame sets the direction

How you organize an initial research question—what categories you use, what gets grouped together—shapes every subsequent step. Structural decisions made early narrow or expand the discovery space downstream.

Format is an argument

Choosing to present findings as a hierarchy implies one set of relationships. A network or cluster implies another. The same data, structured differently, leads researchers to different conclusions.

Speed of comprehension favors visual organization

The brain processes spatial and visual information significantly faster than dense text. In a workflow where you're moving from research to draft quickly, visual structure reduces cognitive load at the moments that matter most.

What gets cited reflects what gets found

Sources that are well-integrated into a visual or linked research workspace are more likely to make it into finished content. Organization isn't neutral—it shapes attribution, emphasis, and the ideas that survive into publication.

AI-assisted research amplifies structural choices

When AI agents iterate on a research brief, they inherit its organizational logic. A well-structured brief produces more focused, usable output. A loosely structured one produces more noise to sort through.

The ability to take data—to be able to understand it, to process it, to extract value from it, to visualize it, to communicate it—that's going to be a hugely important skill in the next decades.

Hal Varian
Chief Economist, Google

Most research workflows still look the same: open a browser tab, read an article, copy a note, repeat. It's linear by default—not because it works best, but because most tools are built that way.

Shifting to a visual, non-linear approach doesn't require overhauling your entire process. It starts with one habit change: map before you write.

Before drafting, spend five minutes placing your key sources and ideas spatially—on a whiteboard, a canvas tool, or even a rough sketch. Group related concepts. Draw connections. Flag gaps. This single step transforms research from a pile of notes into a structure you can think inside.

A few principles that make this practical:

  • Start with clusters, not outlines. An outline forces sequence too early. Clusters let you discover relationships first, then impose order once the shape of the argument is visible.
  • Keep sources attached to ideas. Don't separate your research from your synthesis. When a source lives next to the claim it supports, you catch errors faster and cite with confidence.
  • Iterate visually before committing to prose. Move ideas around until the structure feels right. Rewriting sentences is slower than repositioning a node.

The before-and-after here is concrete: linear research produces a draft that feels assembled. Visual research produces one that feels argued—because the structure was tested before the words were written.

Tools that integrate research and writing in one workspace accelerate this further. When your notes, sources, and draft live together, the visual-to-prose transition stops being a handoff between separate apps and becomes a single continuous workflow.

The Next Generation of Research and Writing Practice Starts Here